
Real Estate Data Analytics: Turning Operational Data Into Recovered Revenue

Every multifamily portfolio sits on a mountain of data. Leases, ledgers, rent rolls, maintenance logs, and resident records pile up across every property. Most of that data goes unexamined, and inside it hides money the operation earned but never collected.
Real estate data analytics is how operators turn that raw data into decisions and dollars. Done well, analytics does more than fill a dashboard. Good analytics shows which units leak revenue and which charges never got billed. The same analysis shows how much income a portfolio can recover.
This guide explains what real estate data analytics is and how operators use it. The right analytics turns scattered data into measurable financial results.
Real estate analytics becomes most useful when it connects property-level data directly to operating performance. NCREIF’s Market Operations Report analyzes property-level operating statistics across metrics including NOI growth, vacancy, expense ratios, and cap rates, turning underlying real estate data into performance indicators operators and investors can use. See NCREIF’s Market Operations Report →
What Is Real Estate Data Analytics?
Real estate data analytics means collecting, organizing, and analyzing property data to sharpen decisions and financial performance. The goal is not charts for their own sake. The goal is insight an operator can act on. Real estate data intelligence, at its best, turns raw records into decisions.
Two kinds of analytics often get confused. Market analytics looks outward, at rents, cap rates, and trends across a region.
Operational analytics looks inward, at the data a single portfolio generates every day. Both have value. Operational analytics is where an owner has direct control, since the data describes the operation itself.
This distinction matters. A market report tells an owner what comparable properties charge. Operational real estate data analytics tells that owner whether their own leases, ledgers, and charges agree. The analysis shows exactly where they do not.
Why Operational Data Goes Unused
The problem is rarely a shortage of data. Multifamily operations generate enormous amounts of it. The problem is that most of the data never gets a close enough look to matter.
A portfolio holds thousands of leases, each with its own terms, plus the ledgers and rent rolls meant to reflect them. Checking all of it by hand is impossible, so teams sample. They review a slice and trust that the rest matches. That trust is where problems hide, because the errors that cost the most are the ones no one looked at.
Property data analytics changes the equation. A system can read every lease, not a sample, and compare every charge against the source. Coverage that no manual process can reach becomes routine, and the data finally earns its keep.

The Core of Operational Analytics: Validation
At the heart of operational analytics sits a simple idea. Before data can guide a decision, the data has to be correct.
Most analytics assumes the underlying numbers are accurate. That assumption is often wrong. When a lease says one thing and the ledger says another, every chart built on that ledger inherits the error. The dashboard looks clean while the data beneath it quietly disagrees with the source.
Validation fixes that. Operational analytics compares leases against ledgers and rent rolls. That confirms the numbers are real before anyone acts on them.
This is the difference between analytics that look impressive and analytics an operator can trust. Our guide to real estate intelligence platforms covers how this validation layer works.
From Analytics to Recovered Revenue
Here is where real estate data analytics pays for itself. The most valuable output is not a trend line. The payoff is a dollar figure: the revenue a portfolio can recover.
When analytics compares every lease against what the ledger bills, it surfaces the gaps.
- A charge written into a lease but never billed.
- A concession that expired yet still reduces rent.
- An escalation that never took effect.
Each gap is revenue the property earned and lost, and each one shows up as a specific, correctable number.
That output turns analytics into financial reporting with teeth. A vague “performance is down” gives way to specifics. An operator sees how much revenue is at risk and how much the system recovered. The report also shows where the remaining exposure sits.
Analytics stops being a rear-view mirror and becomes a recovery engine. Our guide to revenue leakage covers the money side in depth.
Using Analytics to Increase Profitability in a Rental Portfolio
Using analytics for profitability comes down to two levers: earning more and losing less. Real estate data analytics drives both.
On the earning side, analytics surfaces units renting below market and ancillary income left uncaptured. The same analysis flags renewal patterns worth acting on. On the losing side, it catches the billing errors, expired concessions, and missed charges that drain income without notice.
The second lever is often the faster win. Recovered revenue carries no acquisition cost, because the income was already earned.
Using analytics to increase profitability in rental portfolio operations starts with closing those gaps. The gains compound as the same checks keep new gaps from forming. Our guide to increasing NOI covers the full set of levers.
Big Data Analytics and Residential Portfolios
As portfolios grow, the data grows with them, and manual review falls further behind. Big data analytics for real estate solves the scale problem by applying the same checks across thousands of units at once.
For residential real estate analytics, scale is the whole challenge. Residential analytics and residential data analytics both live or die on coverage. A single property is manageable by hand. A portfolio of fifty is not.
Residential real estate data analytics brings consistency to that scale. The same rules apply to every unit. A systematic error surfaces wherever it occurs, not just in the handful someone reviewed.
Business analytics in real estate extends this further, connecting operational findings to portfolio strategy. Leadership can see recovered revenue, open exposure, and performance across every property in one view. Data in real estate finally informs the decisions that matter.
What to Look For in Real Estate Analytics
Choosing an analytics approach comes down to a few questions that separate useful from decorative.
- Does it validate the data, or just display it? Analytics built on unverified data produces confident, wrong answers. Validation against source documents is what makes the output trustworthy.
- Does it cover everything, or a sample? Full-population analysis catches the systematic errors that sampling misses.
- Does it quantify financial impact? The strongest analytics reports in dollars, showing revenue at risk and revenue recovered, not just activity.
- Does it run continuously? A one-time analysis ages quickly. Ongoing analytics keeps the picture current as leases change and new gaps form.
How SurfaceAI Delivers Operational Analytics
AI and data analytics can automate validation work that previously depended on manual review. AICPA & CIMA describes how automated audit testing and data analysis reduced review time and human effort, with teams now expanding AI use to flag higher-risk transactions and improve ongoing analysis. See AICPA & CIMA’s analysis of AI and automation in auditing →
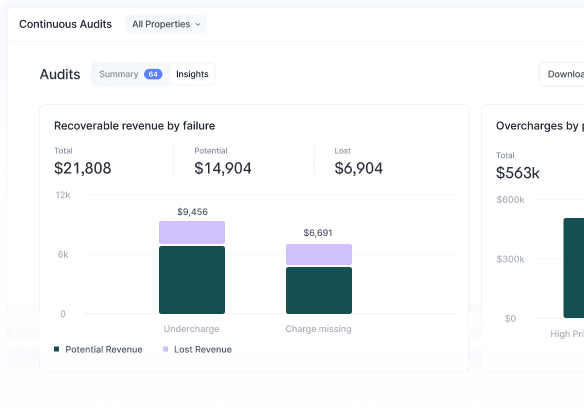
SurfaceAI applies real estate data analytics to the data a portfolio already holds. Rather than pulling in outside market data, the platform analyzes the leases, ledgers, and rent rolls an operator generates daily.
The system reads every lease and compares the terms against the rent roll and ledger. Each discrepancy that represents lost revenue surfaces as a specific, correctable item. The Workspace rolls those findings into a portfolio-wide view. Leadership sees how much revenue the analysis surfaced, how much has been recovered, and where exposure remains.
That design turns analytics into financial results. For an operator, real estate data analytics built this way makes the data finally work. The analytics protects revenue and guides decisions with numbers that reflect reality.

“Surface lets us audit entire communities instead of the sample we used to settle for, with immediate visibility from one dashboard. It's already uncovered uncharged pet rent, parking fees, and under-billed rent. They're easy to work with and quick to deliver. I'd tell anyone considering it to do it.”
Andy Jones
Conclusion
Real estate data analytics is how an operation converts raw data into better decisions and recovered revenue. The value lies not in the dashboard but in the insight. The strongest insight is financial: how much revenue is at risk, and how much a portfolio can recover.
Operational analytics, grounded in validated data and reported in dollars, is where that value sits. Validate the data, cover the whole portfolio, quantify the impact, and keep the analysis running. The data an operation already owns becomes one of its most valuable assets.
Ready to see what your operational data reveals? Book a demo to see how SurfaceAI turns real estate data analytics into recovered revenue.
Frequently Asked Questions About Real Estate Data Analytics